
Compare packaging print offers by separating fixed setup from the per-piece amount, then calculating where their totals cross. The result applies only to the quoted, technically suitable routes. It does not establish that one printing process is best for every small or large order.
Establish a comparable finished result
Use the same artwork revision, substrate, printed areas, color requirements and finishing scope. If one route cannot reproduce the required result, a cheaper calculated total does not make it an equivalent offer.
Record which charges are truly fixed for this run. A setup line may include preparation, plates or another defined activity. Different artwork variants may need separate lines. The tooling-scope record helps identify what a one-time charge actually covers.
Keep freight, tax and assembly outside the print-only calculation unless both offers include them consistently. A cost crossing is useful when its scope stays understandable.
Calculate the run-length crossing
Assume two suitable offers, using fictional USD inputs. Route A costs $240 setup plus $0.60 per piece. Route B costs $40 setup plus $1.00 per piece.
Scroll horizontally if columns extend beyond the view.
| Quantity | Route A | Route B | Lower modeled total |
|---|---|---|---|
| 300 | $420 | $340 | B by $80 |
| 500 | $540 | $540 | Equal |
| 800 | $720 | $840 | A by $120 |
The fixed-charge difference is $200. Route A’s per-piece difference is $0.40, so $200 divided by $0.40 gives a crossing at 500 pieces.
Below 500, B has the lower total under these assumptions. Above 500, A does. At the crossing, non-price requirements can still decide which offer to pursue.
Check the price regions before extending a line
The formula assumes the per-piece amount stays unchanged across the modeled quantities. Real offers may have price tiers, minimum charges or different preparation for another run length. Calculate within each applicable region rather than extending one unit price indefinitely.
If the variable amounts are equal, there is no quantity at which a larger fixed charge pays back through the stated per-piece difference. If the lower fixed charge also has the lower variable amount, that route stays cheaper within the shared modeled scope.
Separate future repeats from the present run. An offer may reuse a tool, but its storage, continued suitability and recurring setup still need actual terms. Counting a hypothetical future free setup today can reverse the apparent choice without evidence.
Request the missing comparison fields
Ask each printer for the setup identity, eligible quantity range and per-piece basis against the same specification. Then present the crossing with the quantities on either side and any technical differences still open. You can choose a route within a stated range without turning a simple calculation into a universal claim about printing technology.
Sources and scope
Australian Government supports the stated general concepts within this scope: Cash inflows/outflows and clear labeling of estimated figures. Access checked 14 October 2026.
The worked scenario is original editorial analysis with assumed inputs, not a supplier offer, customer record or measured Packrivo result. Commercial feasibility and physical suitability remain project-specific.
Check the immediately adjacent quantities
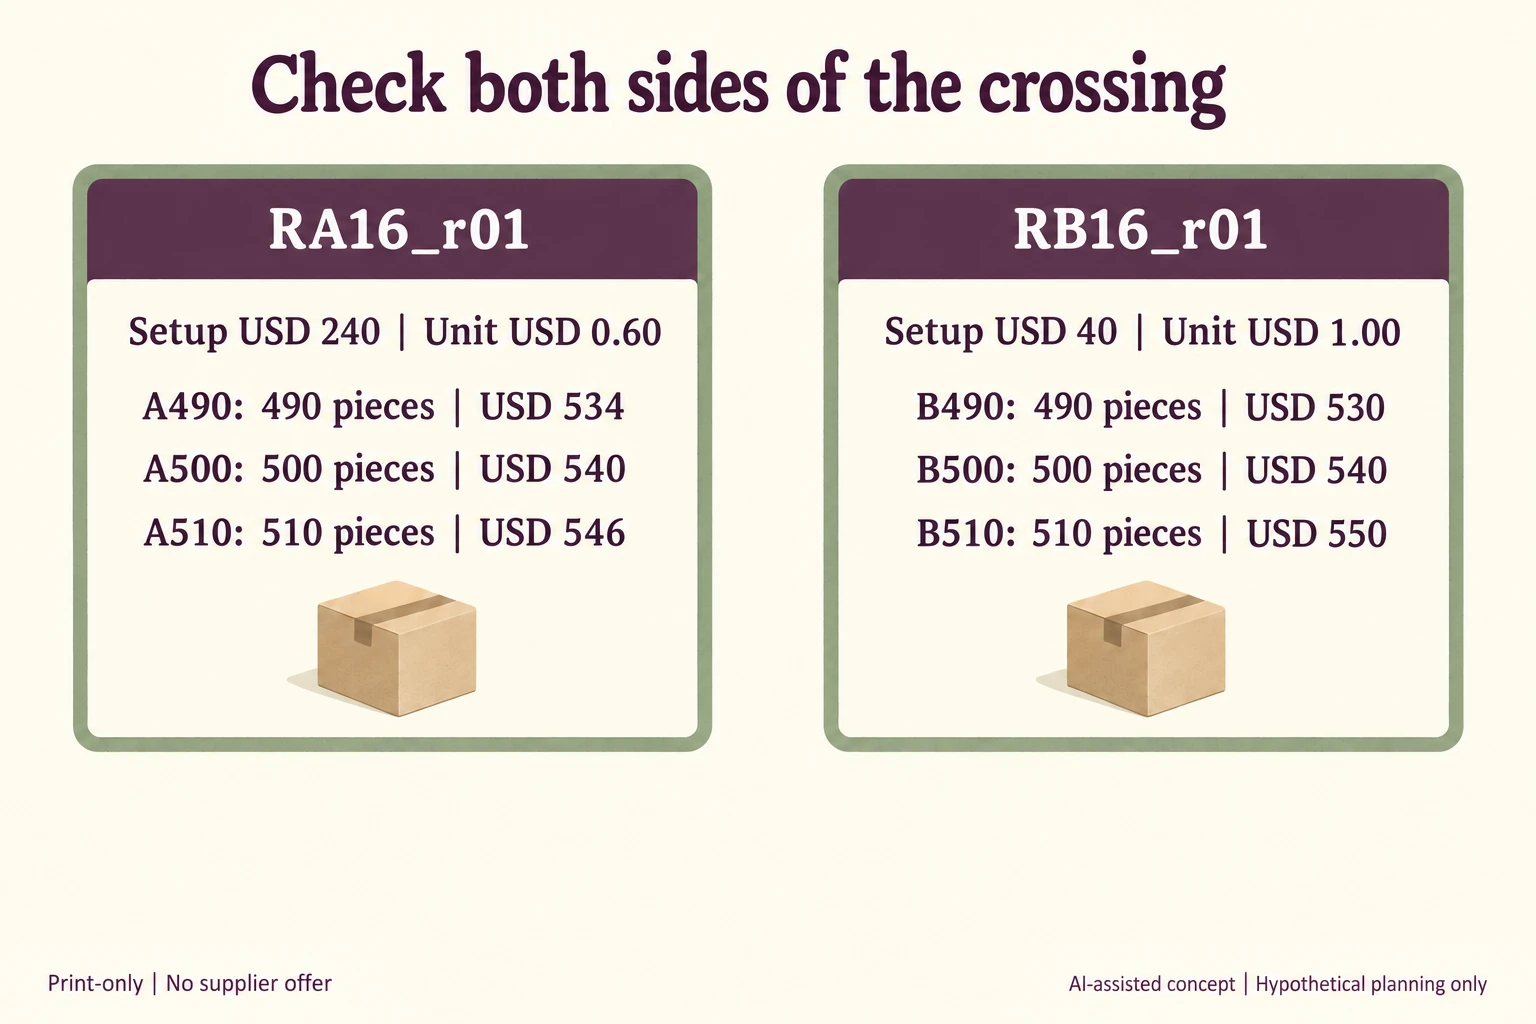
Keep the original fictional setup and per-piece inputs, then examine 490, 500 and 510 pieces. RA16_r01 and RB16_r01 are new hypothetical route references; each route/quantity pair has its own row.
Scroll horizontally if columns extend beyond the view.
| Scope ID | Exact entity | Stage / role | Hypothetical basis |
|---|---|---|---|
| A490 | RA16_r01 | PRINT_ONLY_COMPARISON | 240 + 490 x 0.60 |
| B490 | RB16_r01 | PRINT_ONLY_COMPARISON | 40 + 490 x 1.00 |
| A500 | RA16_r01 | PRINT_ONLY_COMPARISON | 240 + 500 x 0.60 |
| B500 | RB16_r01 | PRINT_ONLY_COMPARISON | 40 + 500 x 1.00 |
| A510 | RA16_r01 | PRINT_ONLY_COMPARISON | 240 + 510 x 0.60 |
| B510 | RB16_r01 | PRINT_ONLY_COMPARISON | 40 + 510 x 1.00 |
| CROSS | COMPARE16_r01 | BOUNDARY_CALCULATION | (240 – 40) / (1.00 – 0.60) |
At 490 pieces the modeled totals are $534 and $530; at 500 both are $540; at 510 they are $546 and $550. The nearby comparison makes the direction of the crossing visible without drawing an indefinite price line. All amounts are invented USD print-only inputs.
The calculation assumes the same technically suitable result and unchanged rate region. Actual technical acceptance, applicable quantity range and quote evidence remain empty in every row. The 490-piece model is not a Packrivo order offer or MOQ exception. Freight, tax and assembly remain outside this print-only comparison.
Download the packaging print setup cost record (.csv). HYPOTHETICAL rows are invented examples. Use ACTUAL_BLANK for permitted project inputs; replace that row label only when recording actual facts. Empty evidence, observation and date fields mean unknown or not performed, never acceptance. Keep checkpoints and revisions separate.
Use the named scope rows and unresolved evidence to prepare a project enquiry. Replace planning assumptions with actual authorised records before a commercial or use decision. Packrivo coordinates independent suppliers. These records establish no supplier offer, service availability or MOQ exception; its published baseline is 500 pieces per product/design.