
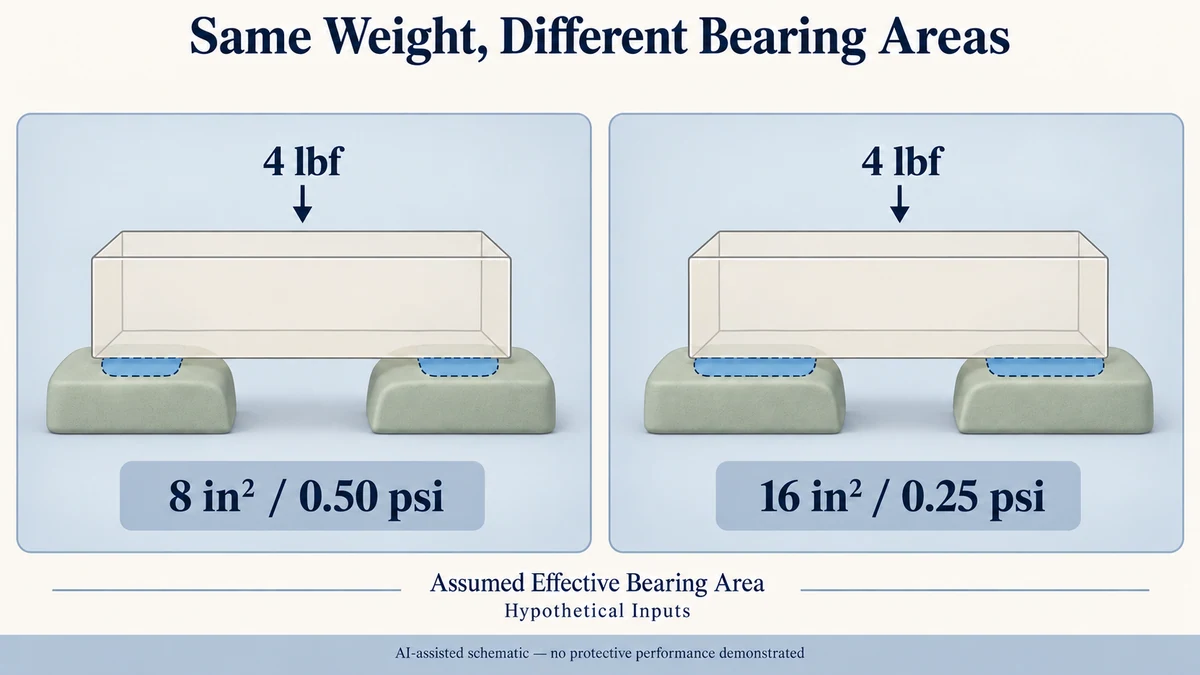
A larger cushioning area does not automatically give a jewellery, candle or gift product better protection during shipping. Spreading the same weight over more cushion area reduces static loading, but a dynamic cushion curve can show poorer shock performance at both low and high loading levels.
In this guide
- Static Loading Locates a Point on a Dynamic Cushion Curve
- Bearing Area Is Not the Entire Foam Footprint
- Doubling Bearing Area Moves the Loading Point Left
- Both Ends of a Cushion Curve Can Be Unfavorable
- Read the Candidate Positions Against Matching Test Conditions
- Shock Curves Do Not Replace Vibration or Complete-Package Evaluation
- Ask for the curve that could answer the two loading coordinates
- Bring the specific open question to the project brief
The useful decision is not simply whether the cushion is thick or generous. It is whether the product’s weight and effective bearing area place the proposed cushion within a suitable region of a relevant dynamic shock curve.
Without a curve representing the intended conditions and a defensible product-fragility criterion, that protection decision remains unresolved.
Static Loading Locates a Point on a Dynamic Cushion Curve
Static loading describes the weight supported by a cushion divided by the area carrying that weight.
Static loading = Supported weight ÷ Effective bearing area
When weight is expressed in pounds-force and area in square inches, the result is pounds per square inch (psi).
The word static describes the loading coordinate. It does not mean that the cushion curve is an ordinary static compression test.
A dynamic shock cushion curve relates that loading coordinate to peak deceleration recorded during controlled impact testing. The horizontal axis normally represents static loading, while the vertical axis represents peak deceleration, commonly expressed in G.
Westpak’s Packaging Dynamics #4 presentation, dated July 2015, explains this relationship on slides 31–37. Its separate cushion curve analysis description describes dynamic shock characterization of cushioning materials under specified test conditions.
A curve must therefore belong to an identified cushioning material and relevant test arrangement. Its shape and reported response depend on conditions including material thickness and impact input. It cannot be treated as a universal performance curve for every foam product.
Bearing Area Is Not the Entire Foam Footprint
A jewellery holder may occupy nearly the whole bottom of a box, but that does not mean its entire surface supports the product.
A ring resting against two cushion features does not automatically load the empty space between them. A candle supported by selected pads may leave other material untouched. An opening cut into a foam block is not bearing area simply because it lies inside the insert’s outside dimensions.
The effective area calculation must concern material genuinely sharing the supported load in the relevant orientation.
Multiple pads also require care. Adding their visible surface areas assumes that all those areas participate in carrying the stated weight. If one pad carries substantially more load than another, a single average static-loading figure can hide different local loading conditions.
Likewise, a decorative or retaining surface should not be counted as a weight-bearing surface without establishing its actual role.
These distinctions matter before reading the curve. An inaccurate area produces an inaccurate horizontal-axis position, even when the arithmetic itself is correct.
Doubling Bearing Area Moves the Loading Point Left
Consider a purely hypothetical small gift product with a supported weight of 4 pounds-force.
Two proposed cushioning layouts use genuinely load-sharing areas of different sizes.
Hypothetical layout A
Supported weight: 4 lbf
Effective bearing area: 8 in²
Static loading = 4 ÷ 8 = 0.50 psi
Hypothetical layout B
Supported weight: 4 lbf
Effective bearing area: 16 in²
Static loading = 4 ÷ 16 = 0.25 psi
The second layout doubles the effective bearing area while keeping the supported weight unchanged. Its nominal static loading is therefore half that of the first layout.
These values are invented teaching inputs and arithmetic results, not measurements from customer packaging, supplier samples or laboratory tests. In particular, the 16 in² calculation assumes that the additional area genuinely carries the load.
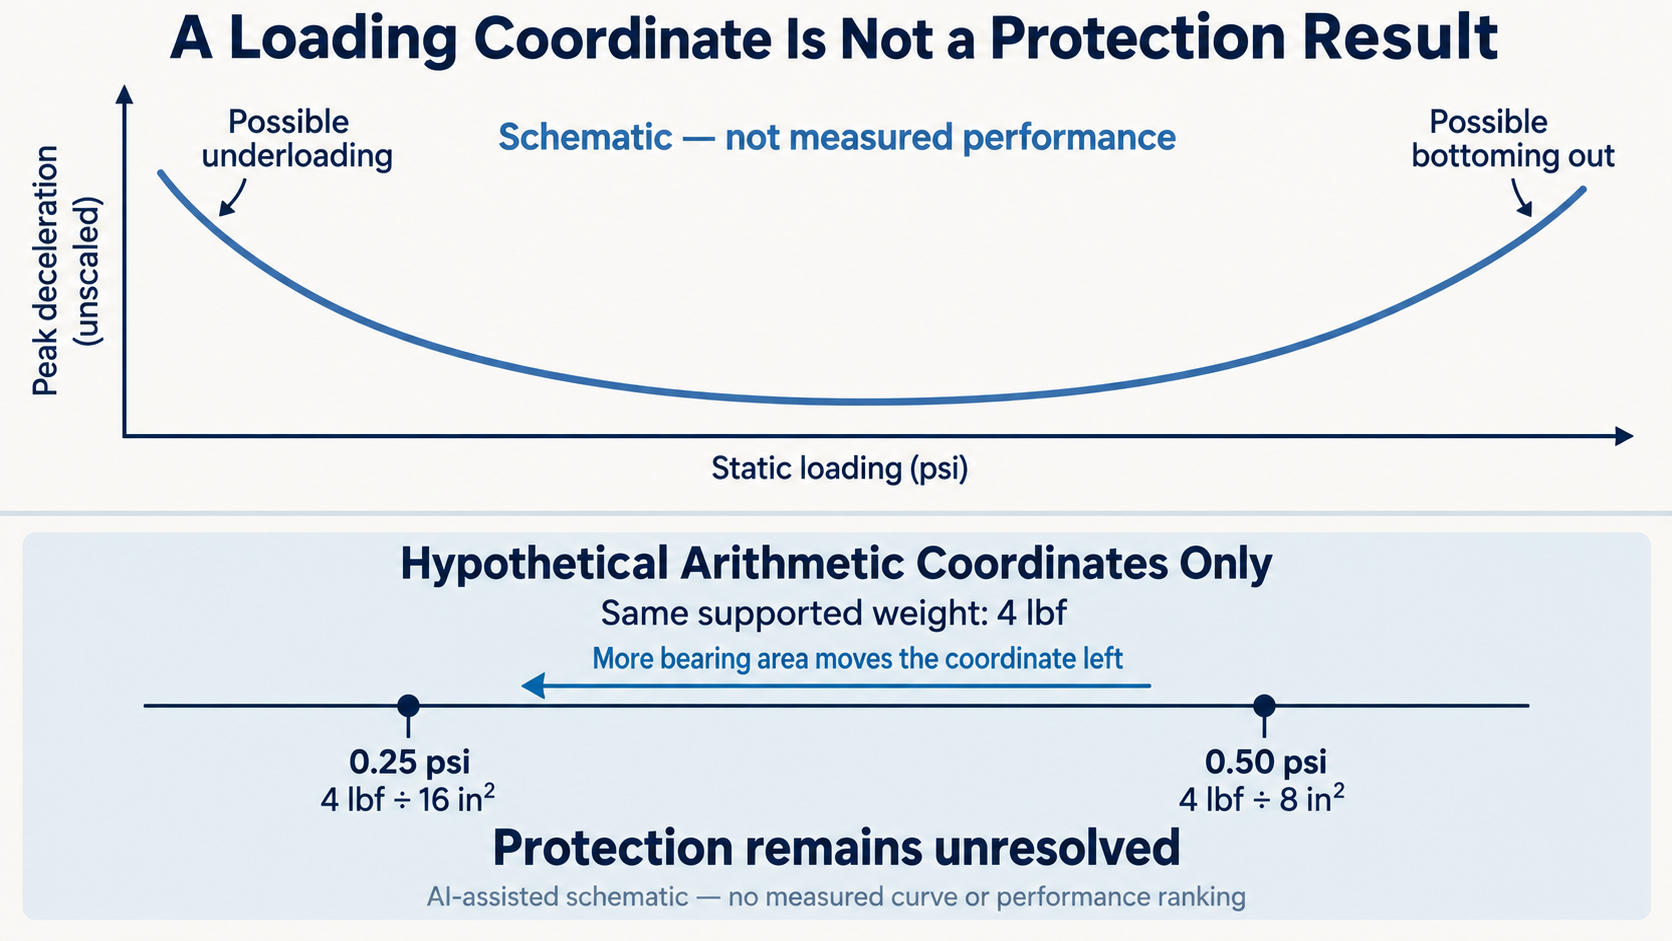
On a cushion curve, the change from 0.50 psi to 0.25 psi moves the design point left along the horizontal axis.
It does not establish that the peak shock deceleration decreases.
If a suitable measured curve happened to place 0.50 psi near a lower-response region and 0.25 psi on an underloaded section, the larger bearing area could produce a less favorable shock response under those test conditions.
Another material or test arrangement could produce a different comparison. Neither outcome can be assigned to these hypothetical layouts without applicable data.
The useful result of the calculation is therefore the location of two candidate loading coordinates—not a ranking of their protective performance.
Both Ends of a Cushion Curve Can Be Unfavorable
A dynamic cushion curve often has a lower-response region between two less favorable loading conditions.
At relatively low static loading, the supported object may not sufficiently deform the cushion during the impact. The resulting shock pulse can be short, with relatively high peak deceleration.
This is an underloaded cushion condition.
Increasing effective bearing area while maintaining the same supported weight reduces static loading. If that change moves the design farther into the underloaded region, adding cushion area can work against the intended shock response.
At relatively high static loading, the opposite problem can arise. The cushion may run out of useful deflection during the impact and bottom out, creating a high-deceleration response.
This is an overloaded cushion condition.
Westpak’s July 2015 presentation distinguishes underloaded, properly loaded and overloaded behavior on slides 34–37. Its examples show why the lower portion of a relevant curve matters more than simply maximizing or minimizing contact area.
The lower portion is not automatically a safe region, however. Even the lowest peak deceleration on an applicable material curve must be interpreted against the actual product’s fragility and the intended shock conditions.
There is no universal optimum psi value that can be assigned to every foam, thickness, product or shipping environment.
Read the Candidate Positions Against Matching Test Conditions
To evaluate the hypothetical 0.50 psi and 0.25 psi positions, the buyer would need a dynamic cushion curve for the proposed material under relevant conditions.
The curve should identify the cushioning material or grade, tested thickness, impact input or drop height, test method, specimen arrangement, reported response and measured static-loading range.
The two positions must fall within a range supported by the relevant test data. A smooth-looking curve is not permission to extrapolate outside the measured region.
The buyer should also avoid comparing curves obtained under materially different conditions as though their vertical-axis results were interchangeable.
The public scope of ASTM D1596-14(2023) describes dynamic shock cushioning characterization using acceleration-time data from impacts on material specimens. It explicitly distinguishes material-level data from performance of the exterior packaging assembly and cautions about predicting in-package results.
That publicly available scope does not provide the complete paid test procedure or establish an acceptance limit for a particular product.
A suitable curve can help a technical reviewer compare the two nominal loading positions. It cannot establish product survival without a relevant fragility criterion and consideration of the actual packed configuration.
If the product’s fragility is unknown, the result remains a material-response comparison rather than a protective pass/fail decision.
Shock Curves Do Not Replace Vibration or Complete-Package Evaluation
Cushioning also influences vibration response, but the shock curve does not tell the entire vibration story.
Westpak’s presentation treats impact cushioning and vibration amplification or attenuation separately. Vibration behavior depends on loading and frequency-dependent response, including possible amplification near resonance.
A loading position that appears promising for a particular impact condition does not automatically demonstrate favorable vibration performance.
The finished packaging system introduces further differences. A foam specimen tested under controlled impact conditions is not identical to a fitted jewellery holder, a candle insert or a complete gift set inside an outer shipping carton.
Actual product geometry, contact locations, restraints, box construction and loading orientation can all affect how the system responds.
Packrivo’s guide to mailer box protection addresses the separate task of reviewing the assembled shipping package. The packaging insert materials guide explains why fit and material form must be defined rather than inferred from a material name.
For a proposed mailer with fitted insert, the dynamic curve question is narrower: does the available cushioning evidence describe the intended loading and shock conditions?
Packrivo can coordinate the relevant component specifications and technical questions during sourcing discussions. Qualified technical parties must determine appropriate material evaluation, complete-package testing and acceptance requirements.
The practical conclusion is that more bearing area is not automatically better cushioning. Calculate the loading position from genuinely supported weight and bearing area, then interpret that position only against suitable dynamic evidence.
If the relevant curve or product-fragility information is missing, neither the smaller nor the larger area has demonstrated adequate shock protection.
Ask for the curve that could answer the two loading coordinates
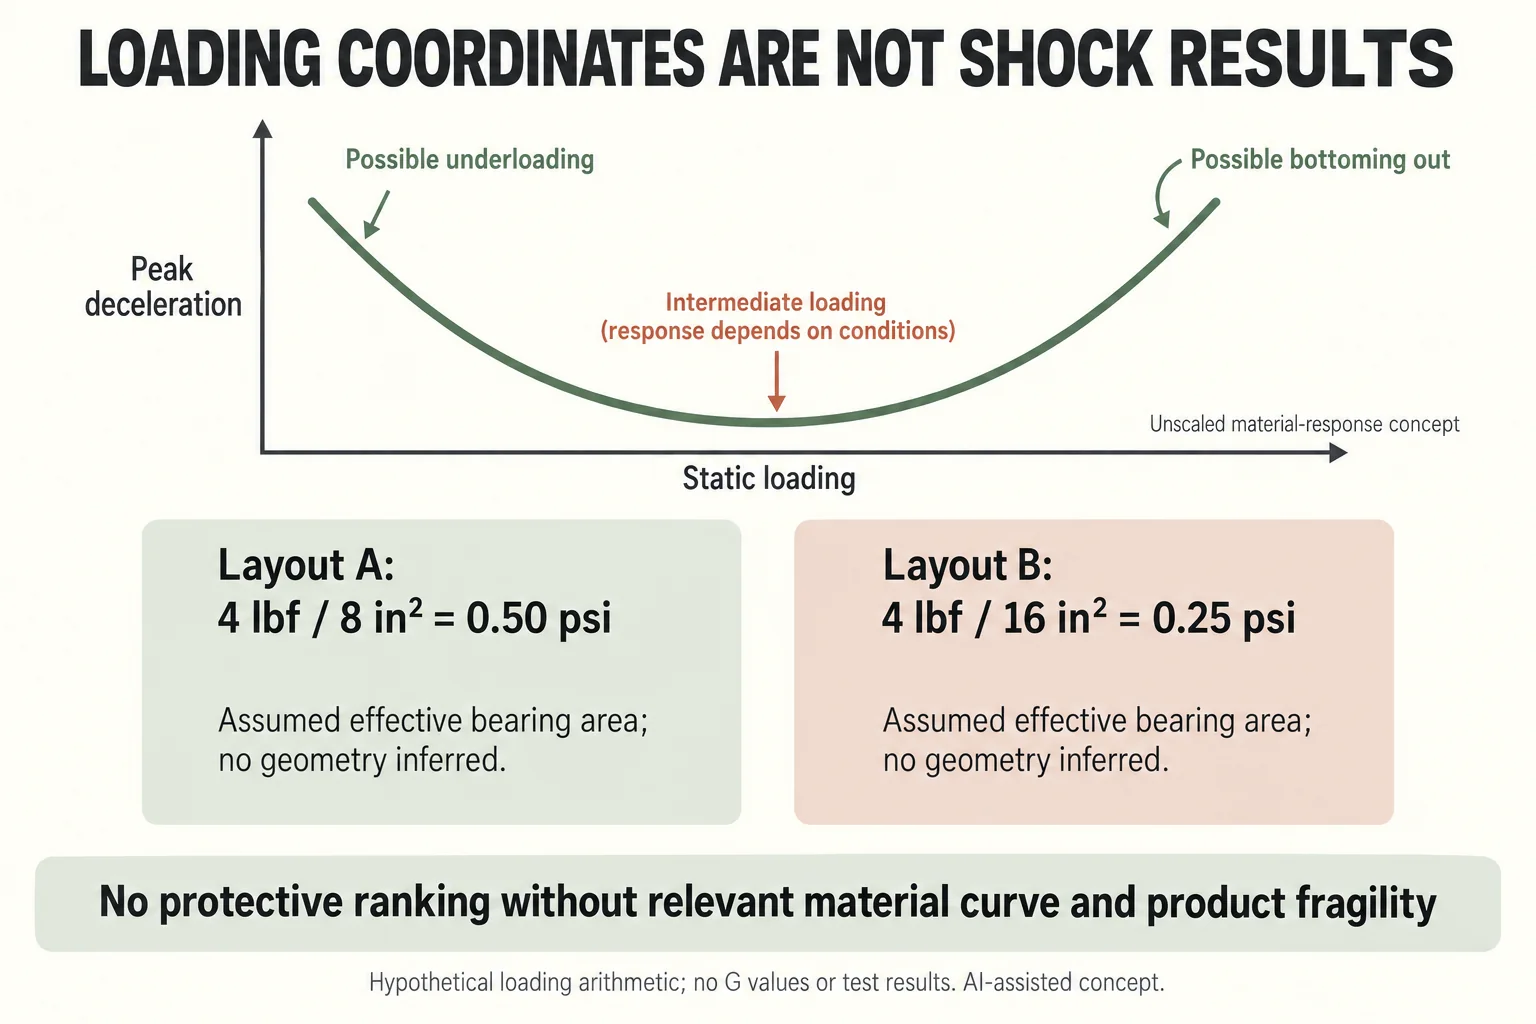
Keep the static-loading calculation and the measured material response in different fields. Layout A’s four pounds-force over eight square inches gives0.50 psi; Layout B’s same supported weight over sixteen gives0.25 psi. Those arithmetic coordinates do not identify their G values.
Scroll horizontally if columns extend beyond the view.
| Decision input | Record for each actual candidate | Open when missing |
|---|---|---|
| Supported weight and area | Actual orientation and genuinely load-sharing area | Do not use the insert outside footprint as automatic bearing area |
| Material curve | Identified grade, thickness, impact input, test method and measured range | No curve intersection or extrapolated response |
| Product criterion | Responsible fragility requirement and scope | No protection pass/fail |
| Complete package | Product, restraints, box, loading and route | Material specimen data does not approve the full assembly |
The new curve sketch intentionally has no numeric ticks or plotted A/B points. Its U-shaped form explains that either low or high loading can be unfavourable in an applicable response curve. It is not evidence that these two hypothetical layouts occupy either region.
Ask the responsible technical reviewer whether a supplied curve represents the actual proposal and whether both loading coordinates fall inside its measured range. Record a missing material identity, thickness or impact condition as a specific request instead of choosing a smooth curve from an unrelated foam.
The insert form and material guide defines the fit proposal. The complete distribution evaluation scope establishes the separate packed-system question. Neither the lower psi nor a larger bearing area ranks protection without the relevant evidence and product criterion.
Download the cushioning curves record (.csv). This file contains field definitions, clearly fictional teaching entries and a blank actual-project row. Keep unknown evidence open rather than copying the example as an approval.
Bring the specific open question to the project brief
For cushion evidence, provide supported weight, true load-sharing area, material grade and thickness, impact conditions and product fragility basis; request the corresponding curve and complete-package assessment scope. Send the current configuration, actual records available, quantity by design, destination and the unresolved question through Packrivo’s packaging inquiry. Packrivo coordinates sourcing and project questions with independent suppliers; the responsible parties confirm materials, service, methods and commercial terms.
Sources checked 10 October 2026. Westpak’s presentation is dated July 2015; its companion service page shows no confirmed publication date. ASTM D1596-14(2023) public catalogue and scope information was reviewed, including the official indexed scope where direct access was unavailable; the paid procedure was not read. The weight and bearing areas are hypothetical, and no actual material or complete package was tested.